

English

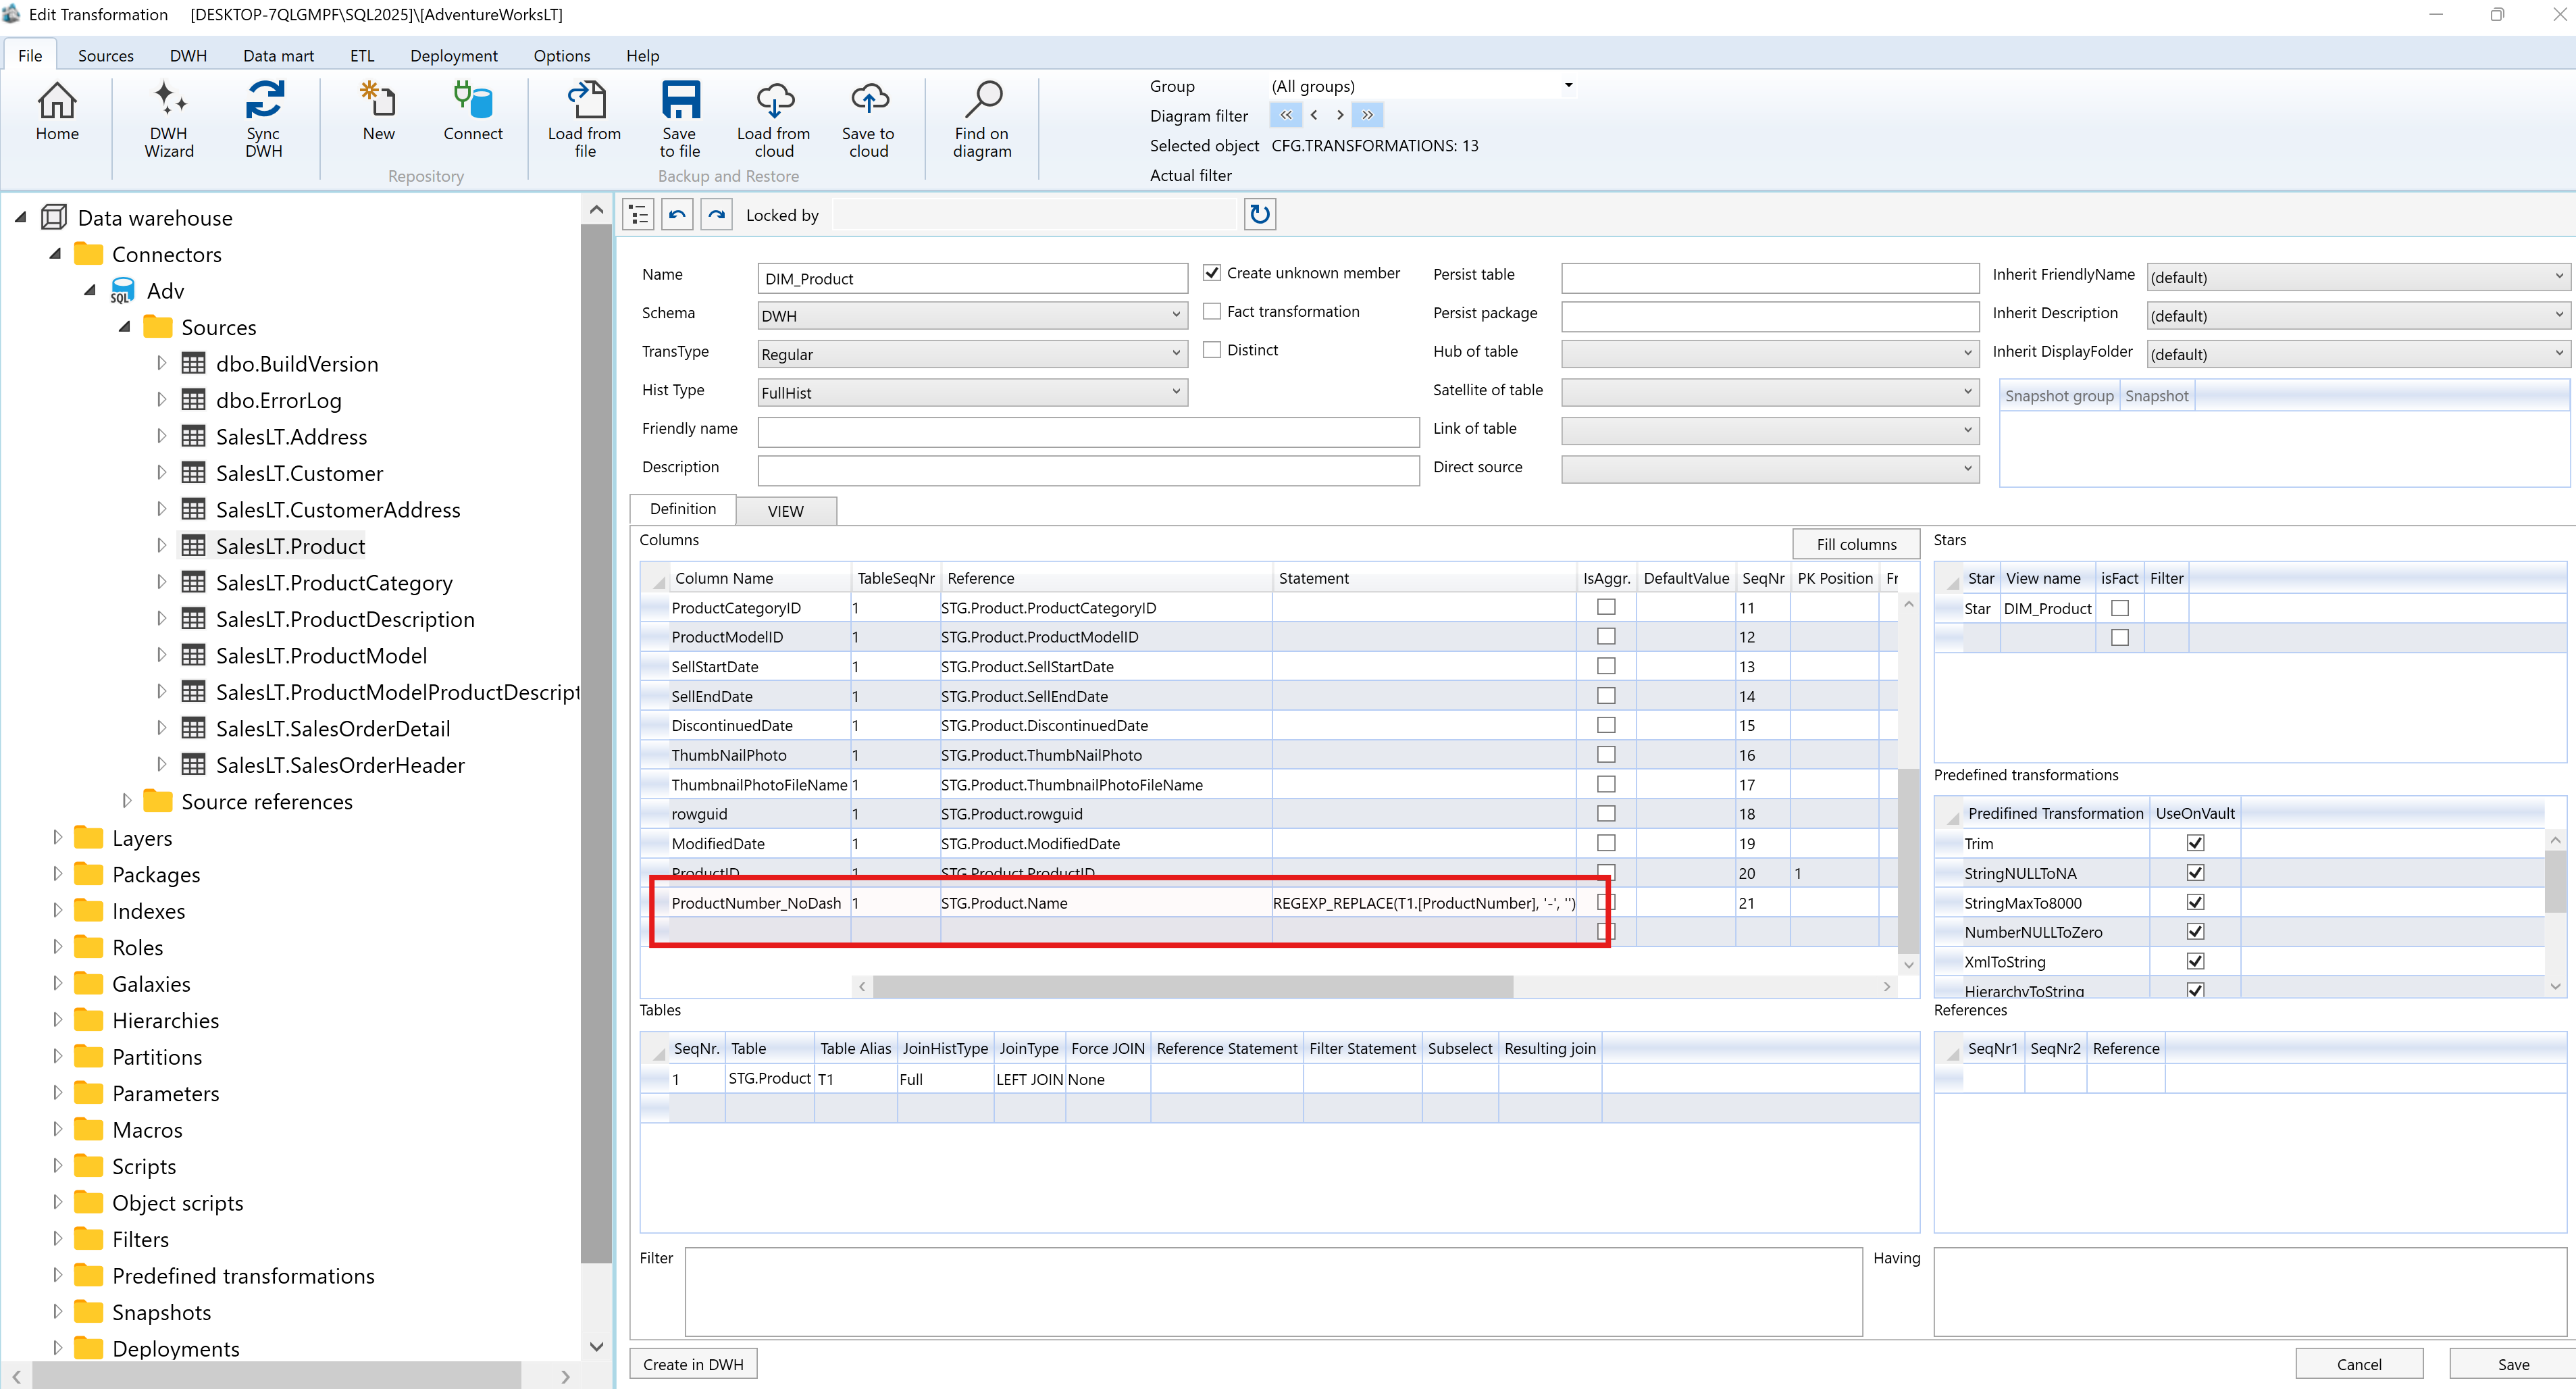
Efficiently model your business and data models, and generate code for your data pipelines, data lakehouse, and analytical applications

Any Source
Read MoreConnect seamlessly to diverse data sources and create a unified data catalog. Our flexible platform consolidates all your data, whether from databases, enterprise applications, or unstructured sources, into a single, cohesive view.

Any Model
Read MoreLeverage a holistic, graphical modeling approach that effectively bridges the gap between business users and developers. Collaborate on a unified representation of data models using modeling wizards for Dimensional/Kimball, Data Vault 2.0, or your custom specifications.

Any Target
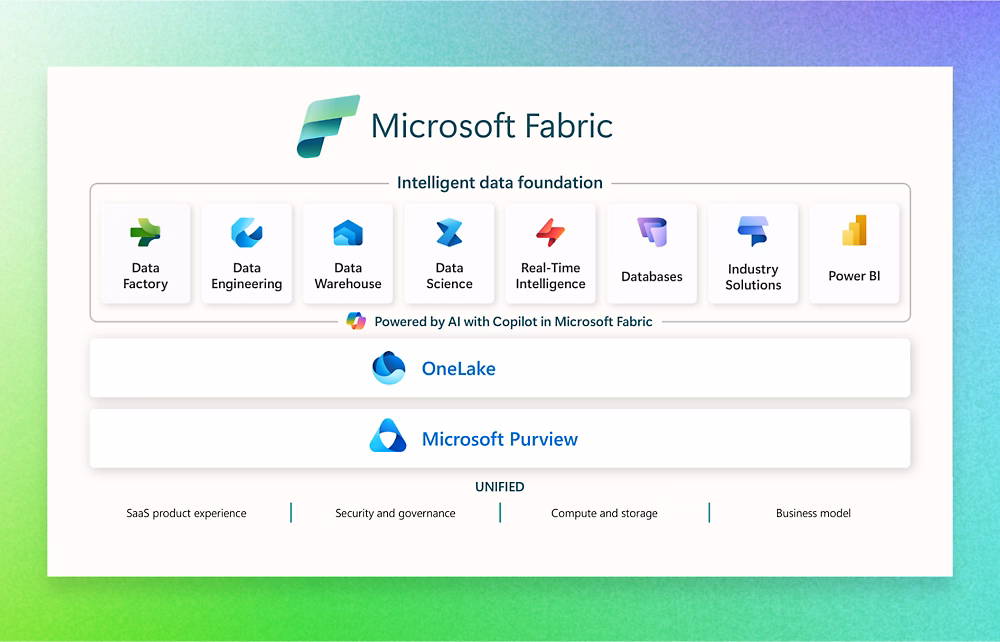
Read MoreMaximize flexibility within your business intelligence ecosystem. Integrate seamlessly with Microsoft Azure and deploy your curated data to any database or data store of your choice. Visualize and analyze your data using your favorite tools like Power BI, Tableau, and Qlik Sense.


Use Cases
New Construction of Data Analytics Platform
Sometimes it is easer and more efficient to build something new to aim the benefits of automated life-time cycles.
Shift your Data Analytics to Azure cloud
Using predefined and custom design patterns, get a fast shift to the Azure data platform.
Modernize your Data Analytics Platform
Helps you transition to a modern data warehouse and data lake architecture by adopt the existing base.
Using a Data Analytics Platform for Power BI
Get more out of your Power BI application and automatically generate data pipelines, data warehouses and Power BI models.
Data Vault 2.0 - Integrate & Switch to
Generate the Data Vault 2.0 modelling approach using wizard suggestions.
Create a Data Analytics Platform from SAP Sources in the Microsoft BI Stack
Transforming seamless and automated, structure and data in a modern Microsoft Azure data warehouse architecture.
Data Lakehouse Automation (DLA)
Generating a hugely powerful and flexible data lakehouse with common design patterns.
Azure Synapse Analytics
In certain cases it makes sense to use the Azure Synapse approach.
Tableau push
Connect with Tableau to Microsoft Azure Analytics, the model will published automatically to Tableau.


Benefits
Proven and trusted technology used in many hundreds of projects since 2004. One person you can do what 5 Experts can do in the same time.
Save Time and Money
- Achieve results in hours, not days.
- Realize goals in days, not extensive weeks.
- Achieve results in hours, not days.
Easy
- Ist's made for experts and for non experts.
- In a couple of days the expert is able to perform a project.
Reduce Your Risks
- Finish with the nightmare of never-ending projects and changing requirements.
- You will have a clear time-horizon over your project upfront.
Modern standards
- Have access to state-of-the-art methods and architectures like Data Vault, cloud solutions, near-real- time, etc.
Work agile
- Change any time and anywhere the holistic data model, code will be generated instantly
Compliance & Governance
- Automated documentation and a powerful Data Lineage brings transparency for all stakeholders
- Top-Down and Bottom Up modeling
Stay Independent
- The result is yours.
- Feel free to use the generated code for whatever you want, as long as you want. Even your subscription has expired
Individual adaption
- Add your own code, do your own design, use powerful macros.
Security
- Tested code, GDPR protection, encrypt data, recovery mechanism, etc.
Reuse previous investment
- Your previous investment in a data warehouses/storages can be completed and reused.
Easy handover
- If the consultant changes to another, everything is documented and clear described.
Independence from technology
- Don't care about fast changing technology.
- From the AC holistic data model you are able to generate the suitable code for new technology.
Testimonials
AnalyticsCreator not only frequently achieves first place in the Data Management Survey, but also got a maximum score of 10/10 in six of the KPIs in 2024, which is a remarkable achievement. 89% of the users surveyed reported having no significant problems with the software, which is an unusually high proportion.

AnalyticsCreator significantly accelerated the development of our central data warehouse, bringing us a major step closer to achieving a unified data interface for powerful analytics.

I highly recommend AnalyticsCreator for companies seeking to streamline their data warehousing and business intelligence processes. It's a remarkably efficient product that empowers users to industrialize these critical services.

AnalyticsCreator empowered us to become data experts, confident in our ability to analyze and utilize our information


AnalyticsCreator has revolutionized data warehouse development and maintenance for our team. It's incredibly user-friendly, taking us to a whole new level of ease and efficiency.


Blog


About the AnalyticsCreator blog:
This blog is where you'll find the latest news and information about data warehousing, data modeling, and data analytics. We also share tips and tricks from our experts, as well as case studies from real-world businesses.
SHOW ALL
.svg "Vector 106 (Stroke)")


-min.png)
.png)